For the last few years, I used interactives to explain science. Today, I launched an interactive to do science.
The post is me "pre-registering" my hypotheses before I collect data. If you'd like to take part in my experiment, do NOT read past this paragraph yet! First do the experiment (takes 7 minutes), and when you're done, I'll see you past the break.
...
...
...
...
...
...
...
...
...
...
...
...
...
...
...
...
...
...
...
...
...
Done? Good! Let's go.
The Inspiration
A few years ago, New York Times released the interactive, You Draw It. The premise was simple: instead of just showing the reader a graph, they first ask the reader to guess what the graph looks like. The idea was, by making you put down your expectations first, you could better see how your expectations (mis)match reality – and thus, learn better.
Others have written about the benefit of breaking your expectations. Ken Bain (2004) called it “expectation failure”. Dan Meyer (2015) called it giving people a headache, then giving them the aspirin. Derek Muller/Veritasium found in a 2007 experiment (original paper, TEDx Talk version) that physics students who watched a confusing video learnt much more than watching a clean, concise video. (an effect size of 0.83, a large effect!)
It's a brilliant idea, breaking people's expectations.
Why not put it to the scientific test?
The Experiment
NYT's You Draw It is quite complex – you guess a curve by drawing it, and the site gives specific feedback of where you over/under-estimated.
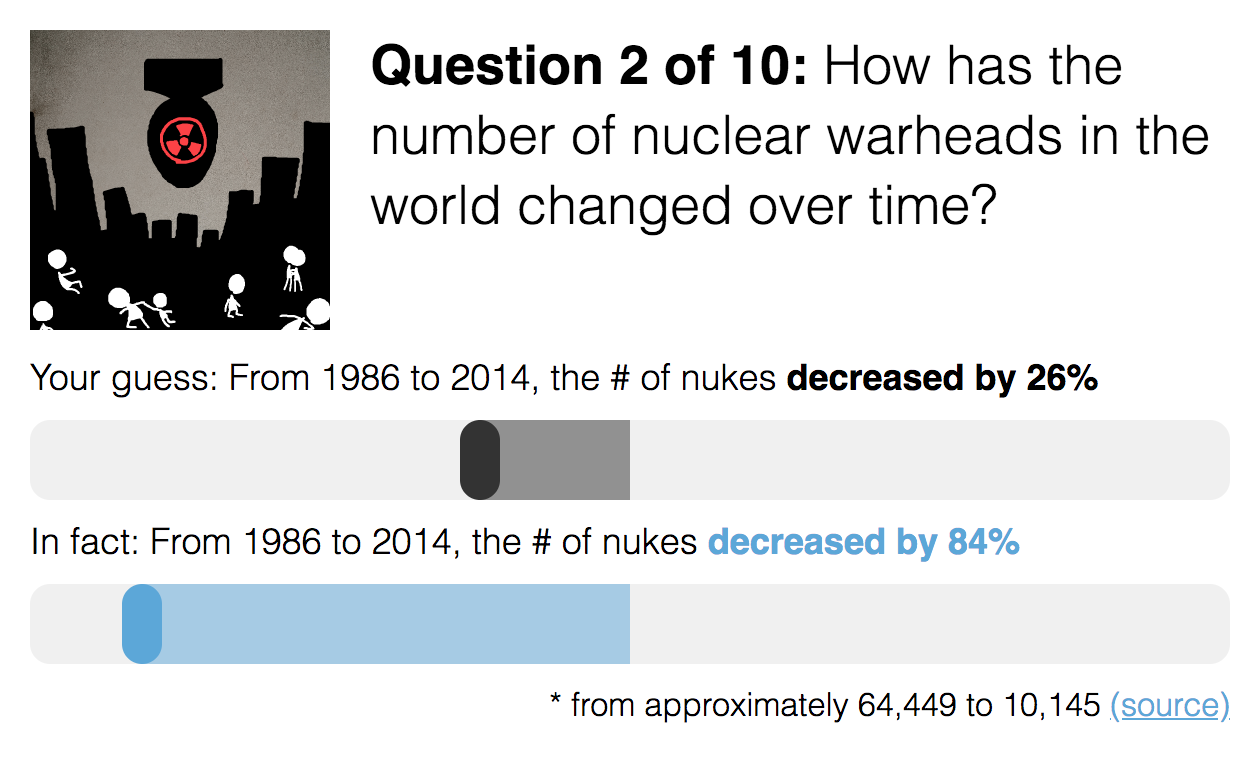
I wanted to test the minimal version of this idea. In my experiment, you just guess a single number, and there's no feedback beyond just showing you the true answer.
Here's what you see in the experimental condition:
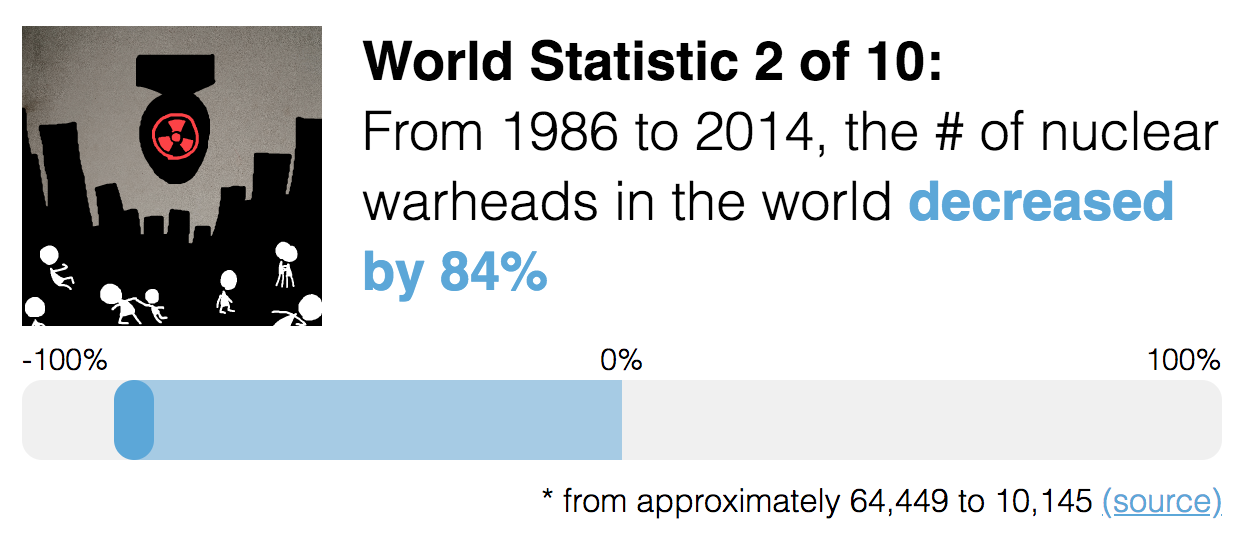
Here's what you see in the control condition: (no guessing, you just see the statistic)
When you go to the site, you're randomly assigned to control or experimental. In both conditions, 10 stats about the world are presented in random order. (I chose 10, to overload short-term memory, which can only hold 7±2 or 4±1 chunks depending who you ask) Afterwards, you take the same short survey, which asks:
- subjective ratings on how Likeable and Surprising the site was (on a scale from 1-10)
- a memory recall test on the 10 stats you just saw (also in random order)
- demographic questions on age, gender, and education level (for exploratory analysis + re-weighing my data to properly represent folks)
The memory test isn't multiple-choice; you can type any number you want. It's unlikely people will remember the exact integers, so I want to give partial marks for close approximations. But how to set up such a scoring system? I don't think an absolute difference of guess - answer works – if the true answer's 80% and you guess 89%, that's much better than if the true answer's 1% and you guess 10%.
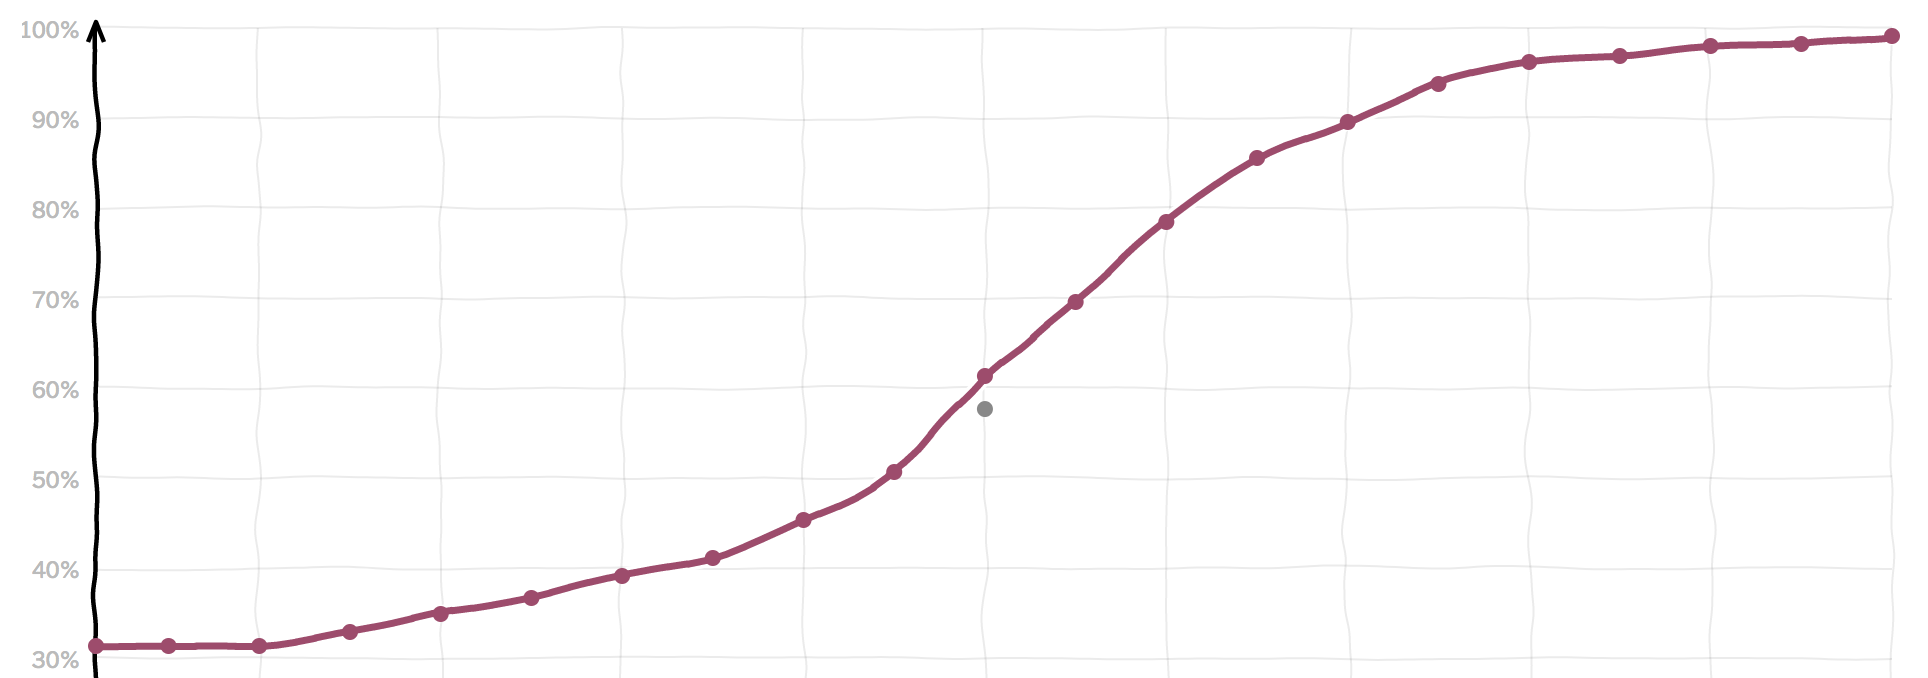
So instead, I'll score based on relative difference, or guess/answer. (none of the answers are 0, so no divide-by-zero error) Then I plug that ratio into this function:
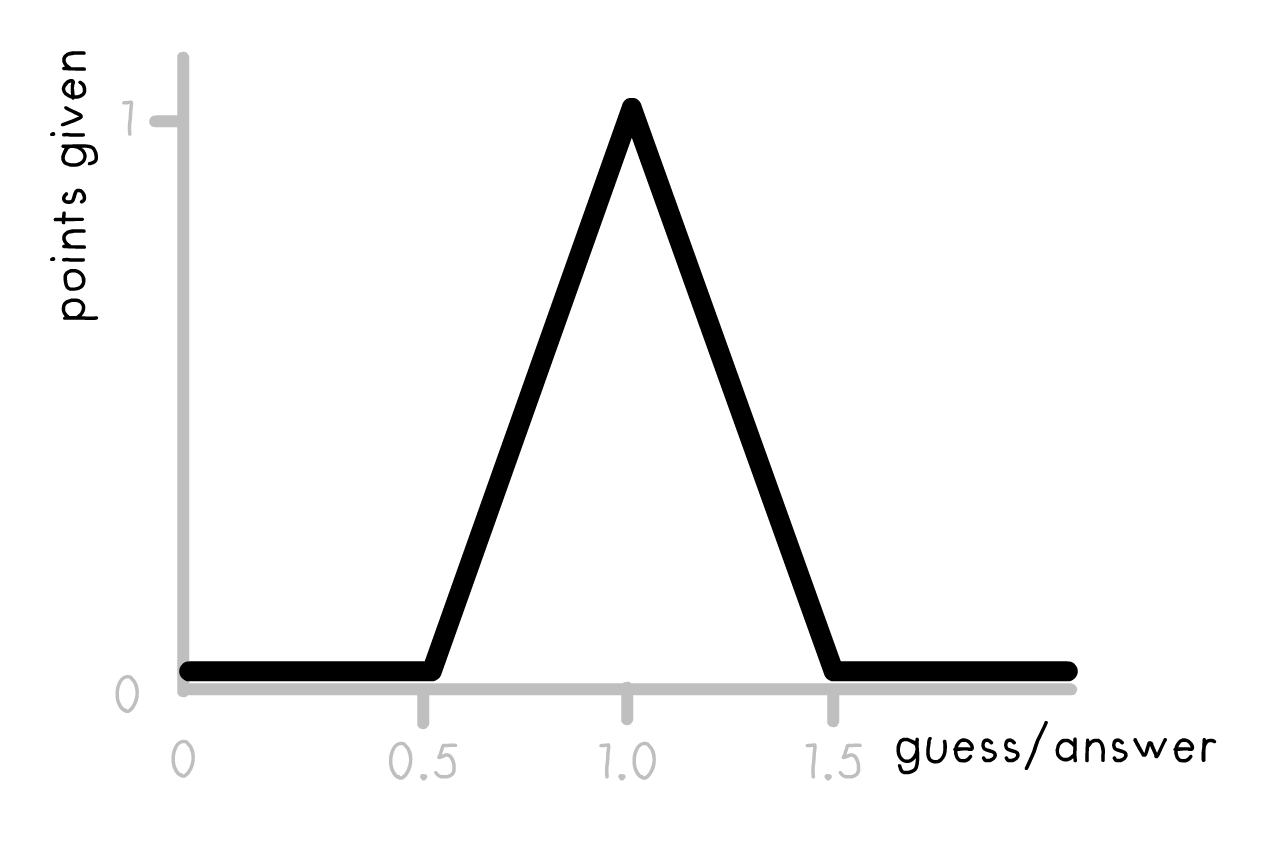
And that's how many partial points you get per question. 1 full point if you're exact, partial marks until you're 50% over or under. The maximum you can get on the whole test is 10 points, minimum 0 points.
So, once I get my data, what are the hypotheses I want to test?
My Hypotheses
TOP HYPOTHESIS:
Simply guessing will have a significant positive effect on memory recall.
If I want to be more daring, I'll predict a "small" effect size. Which sounds like I'm lowballing, but given that it's a dead-simple intervention – guess a number, no feedback – I think even a small effect size would be meaningful, and might convince educators & journalists to add that minimal amount of interactivity to their stuff!
But, if guessing does indeed help, WHY? What's the mechanism? Is it just because it's novel/cool? Or because guessing actually forces you to confront your prior misconceptions? That's my other hunch...
SIDEKICK HYPOTHESIS:
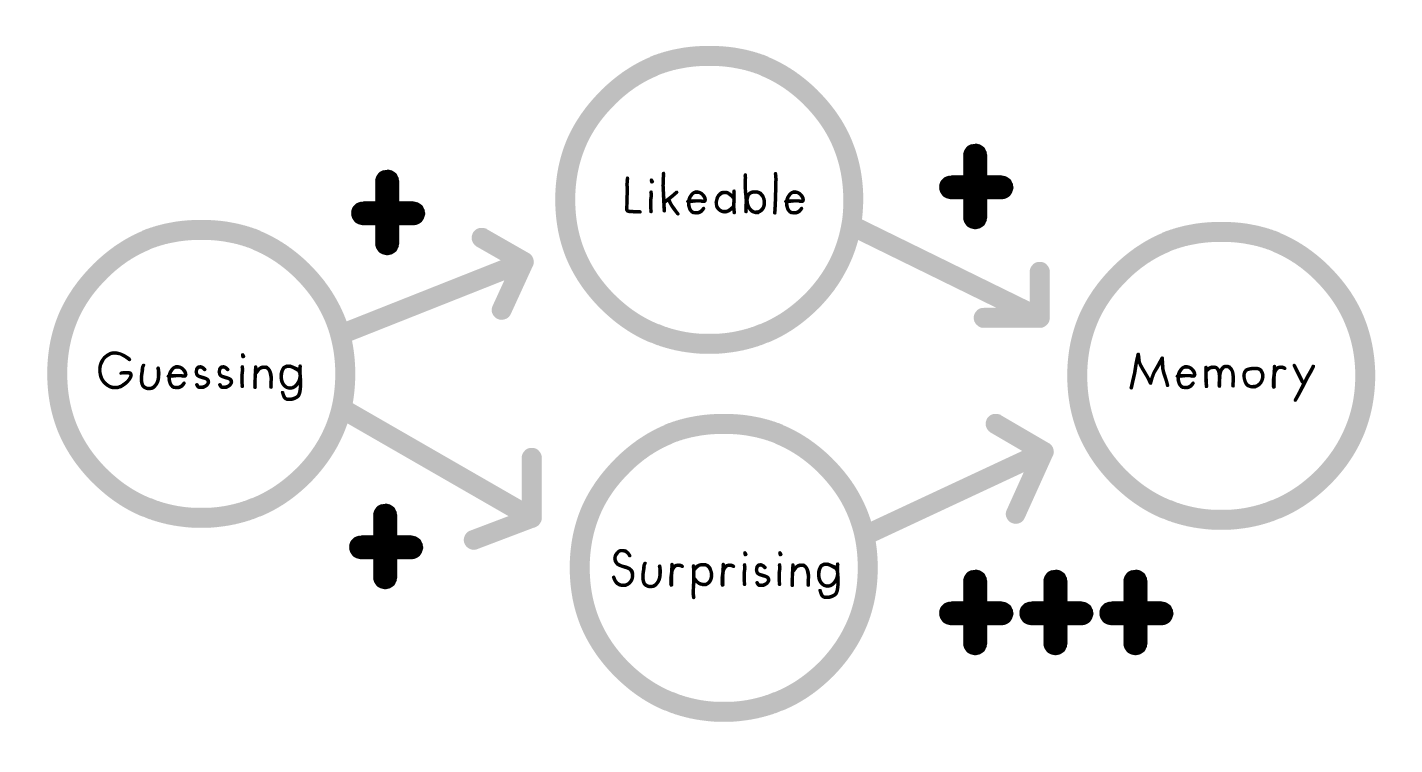
Guessing affects Memory more through Surprising-ness, and less through Likeable-ness.
That's why I ask for subjective ratings of Likeable and Surprising in the survey. I suspect both will have a role, but that Surprising will predict total Memory score better than Likeable.
Here's the causal diagram in my head, where arrows represent possible cause→effect paths: (see Pearl & Mackenzie 2018)
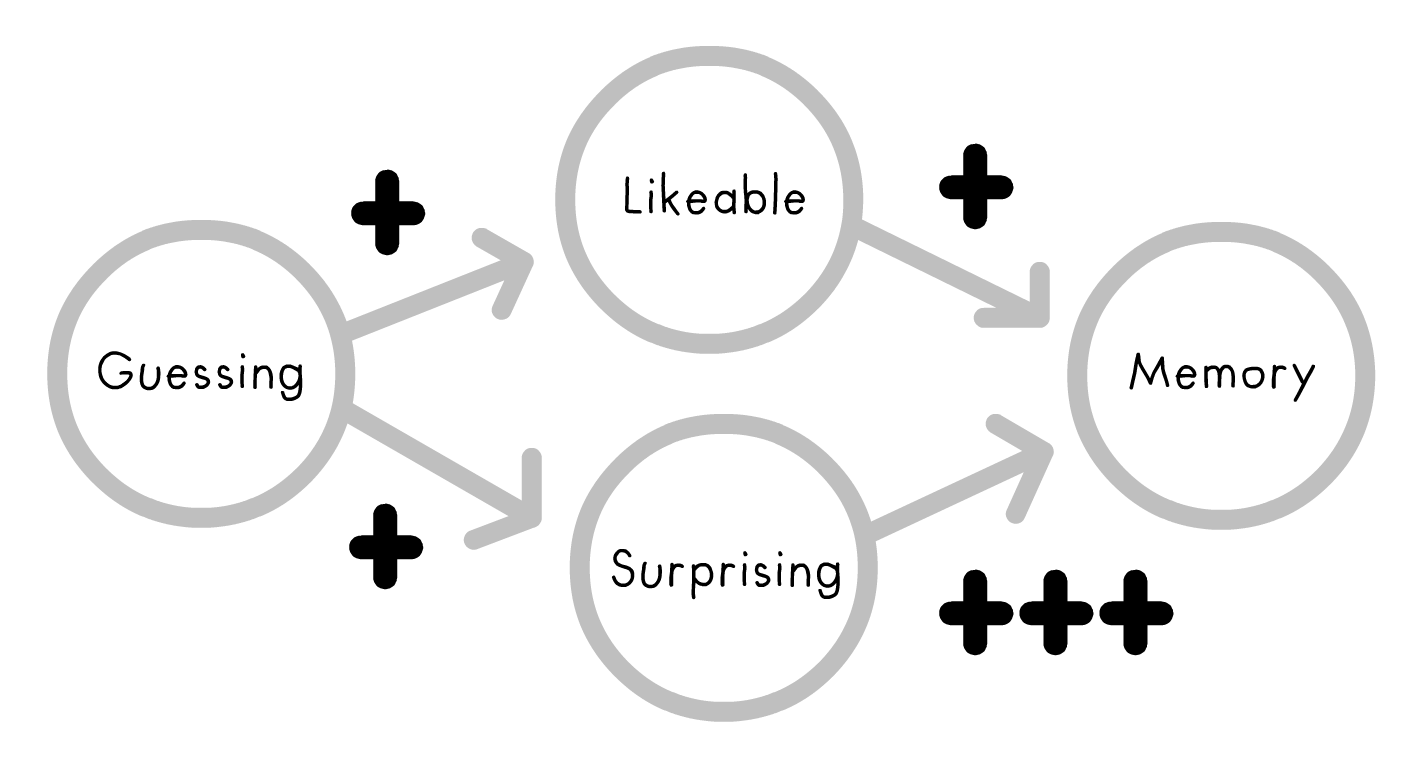
The plusses (roughly) represent my hypothesized "weights" for each cause→effect path. I predict Guessing will increase how Likeable and Surprising the site feels, and that both of those in turn increase Memory, but Surprising will matter much more.
In other words: contrary to clichés about edu-tainment, you can't just add dancing monkeys & theme songs to increase learning. You can't make kids love broccoli by dipping it in chocolate. Likeable isn't enough.
Other than those two hypotheses, I'll also do some exploratory data analysis, and see if there's any other interesting patterns to report.
Anyway, we'll see at the end of the month! Stay tuned... for ✨SCIENCE!✨
